
Comparative statics analysis is invoked in statements about the effects of differences or when linking cause and effect or when comparing a situation “before” with a situation “after”. Good comparative statics starts by clarifying which variables are “exogenous” (e.g., consumer tastes, production technology and so on) and which variables are “endogenous” (often price or quantity or both, especially in the context of a market equilibrium. It studies the effect on the endogenous variables from a change in one or more exogenous variables. Because this principle is the least familiar to students, it may be an unrecognized source of difficulty.
Students may be most familiar with this idea when somebody uses the phrase “ceteris paribus” or “other things being equal”. The Law of Supply and Demand may be the best-known illustration of this principle. So, it may be best to start with this example.
The discussion assumes that you have seen a supply and demand graph. (If not, maybe the discussion will encourage you to learn more about supply and demand, and there are many many sources to choose from.) The discussion is not short because it also offers examples of how the jargon of supply and demand can be abused by people who do not understand the basic principles or do not want to. That discussion leads to a bit of advice when taking tests.
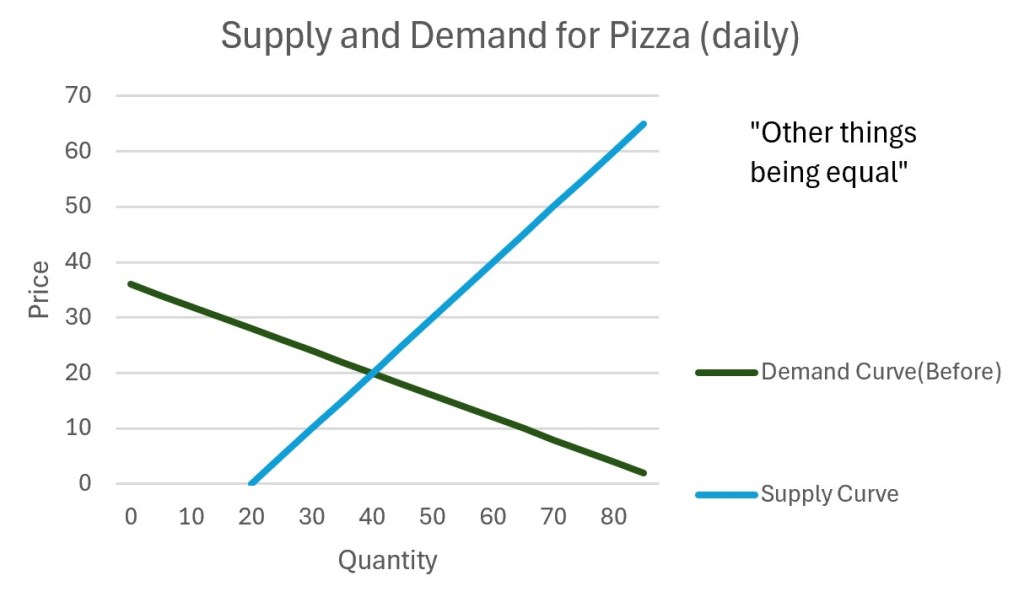
Almost everybody who has walked by a class in microeconomics has seen a supply and demand graph, such as this one concerning the daily supply and demand for pizza in a short run setting.
Comparative statics analysis asks, for example, what changes if the income of consumers increases? The answer is simple and has three parts: the demand curve shifts right, the supply curve does not change (because the direct effect of the change in consumer income is on consumers only) and market forces cause price and quantity to adjust to the equilibrium (i.e., intersection), as shown here. (On a test, an instructor would probably want you to say “Assume that the income elasticity for pizzas is positive: pizzas are a normal good”.)
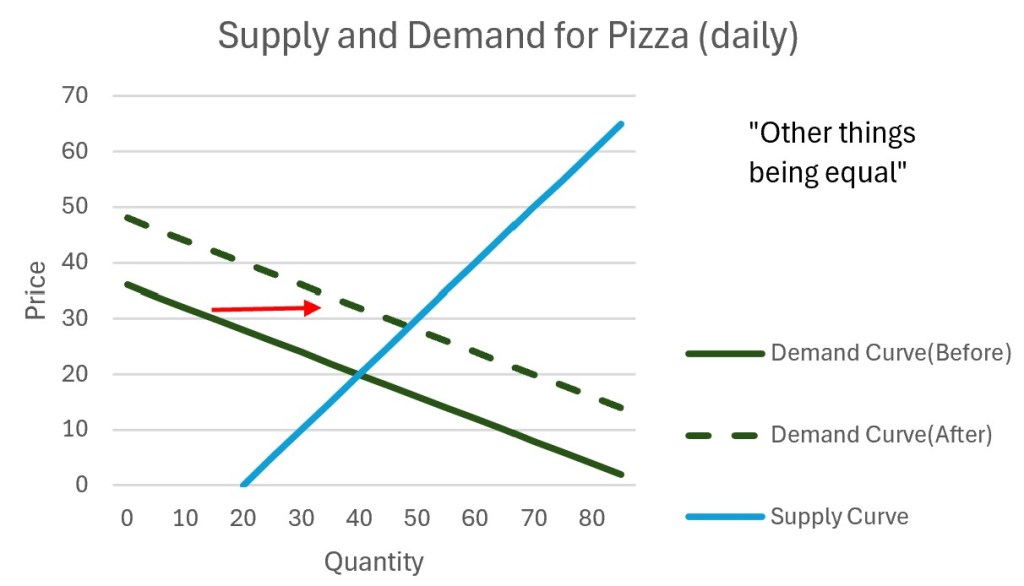
So, the prediction is that a rightward shift of the demand (due to an increase in consumer income, in this case) increases the market price and quantity (both quantity supplied and quantity demanded; at the intersection of the dashed line and the solid line). Obviously! This prediction is one of the four parts of the Law of Supply and Demand.
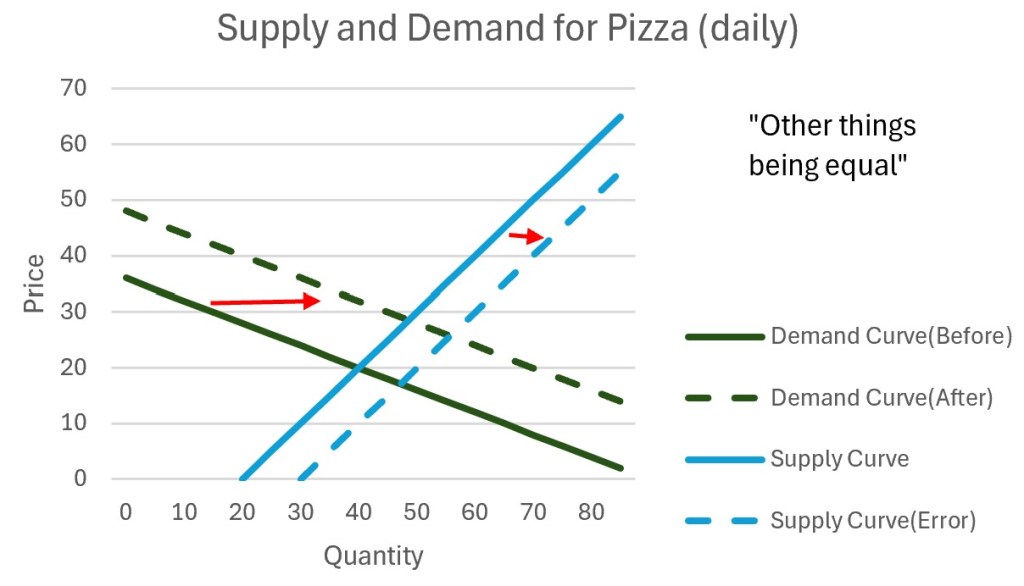
The mistake made by some students is to rush to the conclusion and to ignore what they are taught about changes in quantity supplied as an effect (hint: price elasticity of supply). Very briefly, the graph above shows a three-part wrong answer. It argues that the demand curve increases (for the obvious reason), the supply curve shifts (because, obviously, sellers want to satisfy the increase in quantity demanded) and the market price adjusts to an equilibrium (at the intersection of the dashed lines as explained in class!). The extra line makes reading the graph more complicated, even if it seems to “prove” the expected answer: the price increases.
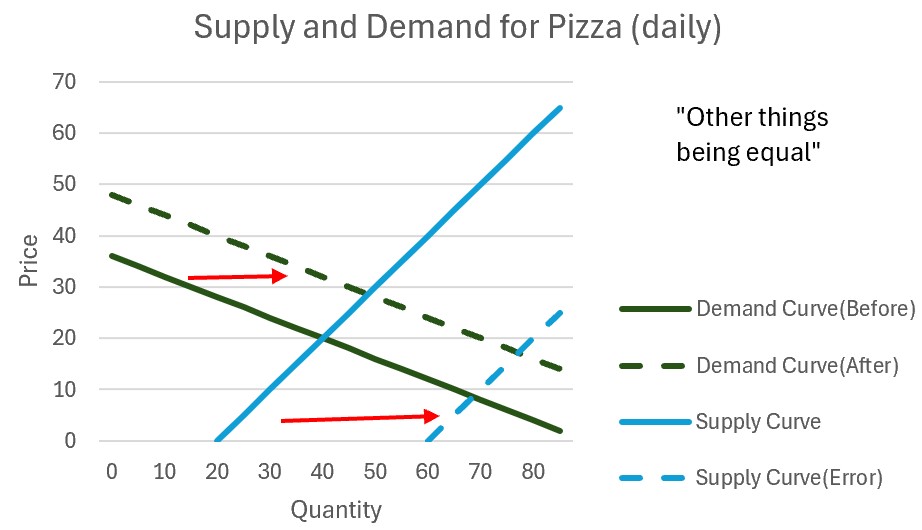
Real world questions can be complicated but not always. There is an easy way to tell when a complicated answer is flawed: an arbitrary change to the same argument can be used to justify a different conclusion. As the graph above shows, carelessness could persuade you that an increase in consumer income decreases the market price, as shown below at the intersection of the dashed lines. The difference between this graph and the previous graph is arbitrary. Arbitrariness makes it appear as if the real answer depends on your skill as an artist. In this case, the proof is careless because it is a confirmation: it confirms what you expect to be true rather than proving that it must be true.
In my opinion, one reason why it is so easy to fool students with this type of question is that, rather than thinking like an economist, they think of the conclusion first. In this case, many people start by thinking that the answer is obvious: quantity supplied increases. With that answer is obvious then it is easy to torture the logic of economic models and conclude that the supply curve should shift. There are many reasons why a supply curve could shift, but it is not obvious that any of those reasons are relevant to this question.
A better thinking process starts by using the information given to you: identify what really changes and then think about the implications of those changes. In this case, both “a shift of the supply curve” and “a movement along a supply curve” describe a change in quantity supplied but the different phrases imply a radically different understanding of cause and effect. The question that should be asked is: would quantity supplied change due to an increase in consumer income if the price does not change? If the answer is No, as in this case, then the supply curve should not shift.
So, a bit of advice: tests in many economics classes become much easier if you think about the difference between a “shift of” and a “movement along” in a curve on a graph. This advice is not a deep secret, and your written answer does not need to use a graph. This advice is not a way to make your instructor happier by using the jargon correctly. This bit of jargon is associated with applying principle of comparative statics correctly.
More Examples of Bad Comparative Statics
This principle is likely to be the least familiar of the five. It takes time and experience to learn. Academic economists may encourage you to learn formal models of a market or an economy and to take many classes. For people unwilling to take the time to learn, there are many paths to a wrong answer. For example,
- “Post hoc ergo propter hoc” (Latin for” after this therefore because of this”): e.g. last year, “we tried decreasing price and total revenue increased. If we do the same again, revenue will increase more.” This argument fails the comparative statics principle because the argument relies on the price as the cause and total revenue as the effect. Considering the context for why the price changed may reveal a more reliable cause of both the change in price and the change in total revenue.
- “Spurious correlation” is a correlation between two endogenous variables that misleads. Correlations can even look good in terms of its statistical properties, which can deceive people who think that data analysis is the key to wisdom. Measuring a historical correlation between endogenous variables is unstable: if past events have been driven by changes on the demand side then they offer little insight when a change come from the supply side.
Note: Most of the correlations presented in this website attempt to measure a correlation between exogenous variables. That is also a waste of time since, by definition, exogenous variables are not caused by anything else that you are considering. The principle of comparative statics starts by asking you to distinguish exogenous variables and endogenous variables, in order to study the effects of exogenous variables on endogenous variables.
Other types of comparisons are also flawed but the flaw may be due to carelessness. For example,
- Claims that a price trend is inevitable, especially if stated by somebody who displays a chart with the price rising over a long time. The fact that the market price is endogenous to market demands that you think carefully about what would causes the price to increase. Even if you do not believe in the equilibrium principle, the fact that the market price has increased over such a long period of time should encourage you to question why price has separated from market forces that are relevant almost always. History offers many examples where an increasing trend in prices reverses direction, especially when the price becomes so high that the excess profits attract competitors into the market.
- “Taste” vs. “behavior”. Many people use these two words interchangeably even if doing so creates confusion in the situations that economists are often asked to consider: a change in taste changes behavior but a change in behavior does not necessarily reveal a change in taste (i.e., other reasons are worth considering).
- “Gaming the system”: Consider a psychology test used to determine if a job applicant is reliable. Many years of laboratory studies may determine that the test is valid and the results may have been published in a highly respected academic journal. However, if applied in the real world, where job applicants know that the test questions, then the same test become unsuitable. In a lab, different types of job applicant give different test answers, but the real world adds incentives which change the answers to the test: i.e., unreliable job applicants do not want to appear unreliable. More formally, the comparative static prediction (concerning answers to the test) in a lab differs from the comparative static prediction (concerning answers to the same test) in the real world.
These examples show that the principle of comparative statics adds power to an argument and is not simply a new bit of vocabulary. This blog will offer more examples.
Now, it is your turn to write.
- Have you seen any insightful examples of comparative statics analysis?
- Have you seen any shockingly bad examples of attempted comparative statics analysis?
- Can you see any limits to the application of this principle?
- Can you imagine any questions for which finding the answer requires combining comparative statics analysis with other ideas familiar to economists?
An Aside that is Probably Irrelevant to You
The statement “other things being equal” or “ceteris paribus” is not simply a bit of jargon used to intimidate non-economists. This jargon is also something that annoys people who want to know more about “real world” in which it is unreasonable to assume that “other things” stay equal. This bit of jargon is reminder that the careful analysis focuses on one change at a time. It is possible to understand the effect of a combination of changes which happen at the same time, such as a decrease in consumer income and lower price. That understanding also starts with the same understanding of the difference between exogenous (cause) and endogenous (effect) as implied by “ceteris paribus”.
Understanding also requires some numeracy skills since, very quickly, somebody will want to know “how big was the decrease in income?”, “how big was the price decrease” in order to answer the real question: “which effect dominates?” For people who have taken enough calculus to know the difference between a partial derivative and a total derivative, considering the combined effect is not difficult: the solution adds the effects of the change in each exogenous variable. As an approximation, the total effect is the sum of the individual effects where the effect of any one change is the relevant elasticity times the percentage change in the relevant variable. For example, suppose that there is a 10 percent decrease in price and a 5 percent decrease in consumer income. Estimating any effect on quantity demanded depends on knowing the price elasticity of demand (suppose that it is -0.8) and the income elasticity (suppose that it is +1.2). The change in income shifts the demand curve in by 6 percent (-6%= +1.2 × -5%) and the change in price causes movement along the demand curve by 8 percent (+8%= -0.8 × -10%). Therefore, the total change in quantity demanded is +2 percent (+1.2 × -5% -0.8 × -10%= +2%), approximately.
What would cause the price to fall by 10 percent? This is a different question because the change in price is an effect. For example, you might be interested in knowing the total effect on price (and on quantity demanded) of a 10 percent decrease in consumer income and a 7.5 percent improvement in productivity. Finding the answer is not as simple, because the arithmetic changes, although the discussion above indicates that finding the answer is not hard. The challenge for economics instructors who want to teach these ideas is that too many people think that math has no possible use outside of a math class.

Leave a reply to Economic Lessons Hidden in Popular Movies – 5 Basic Principles of Economics Cancel reply